Mandelbrot set with variations
The Mandelbrot set $\mathscr M$ is the set of points $a$ in the complex plane for which the Julia sets are connected. This happens to be the same set of points that iterations of the equation
\[z_{n+1} = z_n^2 + a \tag{1}\]do not diverge (go to positive or negative infinity) but instead are bounded upon many iterations at a starting value of $z_0 = 0$. Thus the Mandelbrot set is very similar to the Julia set but instead of fixing $a$ and varying $z_0$ at different points in the plot, instead the starting value of $z_0$ is fixed at 0 and the value of $a$ at different points in the complex plane are plotted.
Let’s compute $\mathscr M$. As for the Julia sets, the simplest way to do this is to initialize a complex plane as an ogrid array in numpy, with the difference being that a is assigned to this array, not z, which is instead asigned to an identically sized array of 0s.
#! python3
import numpy as np
import matplotlib.pyplot as plt
plt.style.use('dark_background')

def mandelbrot_set(h_range, w_range, max_iterations):
	y, x = np.ogrid[-1.4: 1.4: h_range*1j, -1.8: 1: w_range*1j]
	a_array = x + y*1j
	z_array = np.zeros(a_array.shape)
	iterations_till_divergence = max_iterations + np.zeros(a_array.shape)
Now we can iterate at each position of z_array until the value diverges, using the value of a in a_array. Finally, call the function and plot the results!
	for h in range(h_range):
		for w in range(w_range):
			z = z_array[h][w]
			a = a_array[h][w]
			for i in range(max_iterations):
				z = z**2 + a
				if z * np.conj(z) > 4:
					iterations_till_divergence[h][w] = i
					break

	return iterations_till_divergence

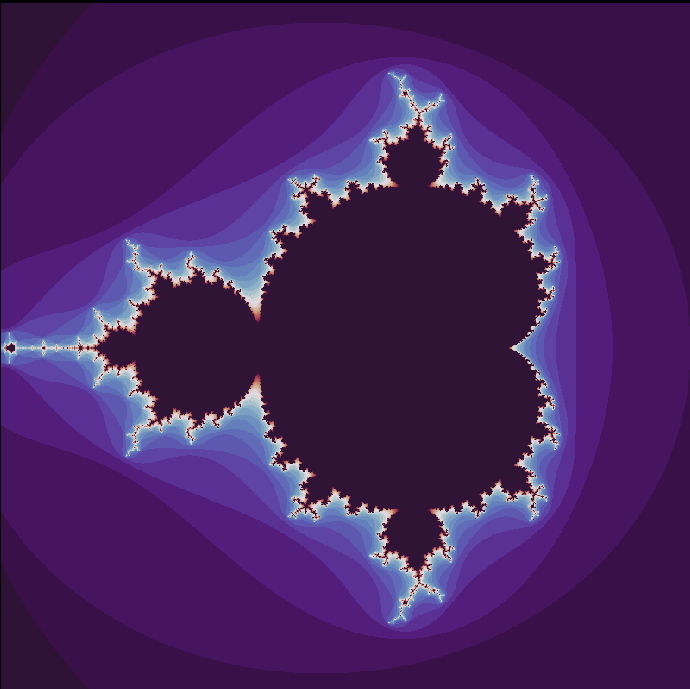
plt.imshow(mandelbrot_set(800, 800, 30), cmap='twilight_shifted')
plt.axis('off')
plt.show()
plt.close()

This method is perfectly good, but slow. Luckily we can use the numpy ogrid to compute divergence much faster! (see the Julia sets page for more information)
import numpy as np
import matplotlib.pyplot as plt
plt.style.use('dark_background')


def mandelbrot_set(h_range, w_range, max_iterations):
	# top left to bottom right
	y, x = np.ogrid[1.4: -1.4: h_range*1j, -1.8: 1: w_range*1j]
	a_array = x + y*1j
	z_array = np.zeros(a_array.shape)
	iterations_till_divergence = max_iterations + np.zeros(a_array.shape)

	for i in range(max_iterations):
		# mandelbrot equation
		z_array = z_array**2 + a_array

		# make a boolean array for diverging indicies of z_array
		z_size_array = z_array * np.conj(z_array)
		divergent_array = z_size_array > 4

		iterations_till_divergence[divergent_array] = i

		# prevent overflow (numbers -> infinity) for diverging locations
		z_array[divergent_array] = 0

	return iterations_till_divergence

plt.imshow(mandelbrot_set(2000, 2000, 70), cmap='twilight_shifted')
plt.axis('off')
plt.savefig('mandelbrot.png', dpi=300)
plt.close()
This code is perfectly valid for mapping $\mathscr M$, itself (the dark region), but the colors look strange: there is a banding pattern that is not seen in the plot from the other program for $\mathscr M$.

A little retrospection can convince us that there is a problem with how we compute the first iteration of divergence, mainly that sometimes this program does not actually store the first iteration but instead a later one! Remember that $a$ is being added to $z$ for every iteration even if $z = 0$, as we have set it to stop the values from getting out of hand. This could cause a later iteration to become larger than 2 (see here, and the code as it stands would record this later value as the iteration of divergence. This can be remedied by introducing another boolean array not_already_diverged that keeps track of which points in the plane have previously headed off towards infinity as follows:
def mandelbrot_set(h_range, w_range, max_iterations, t):
	y, x = np.ogrid[1.6: -1.6: h_range*1j, -2.2: 1: w_range*1j]
	a_array = x + y*1j
	z_array = np.zeros(a_array.shape)
	iterations_till_divergence = max_iterations + np.zeros(a_array.shape)

	# make an array with all elements set to 'True'
	not_already_diverged = a_array < 1000

	for i in range(max_iterations):
		# mandelbrot equation
		z_array = z_array**2 + a_array

		# make a boolean array for diverging indicies of z_array
		z_size_array = z_array * np.conj(z_array)
		divergent_array = z_size_array > 4
		diverging_now = divergent_array & not_already_diverged

		iterations_till_divergence[diverging_now] = i
		# prevent overflow (numbers -> infinity) for diverging locations
		z_array[divergent_array] = 0

		# prevent the a point from diverging again in future iterations
		not_already_diverged = np.invert(diverging_now) & not_already_diverged

	return iterations_till_divergence
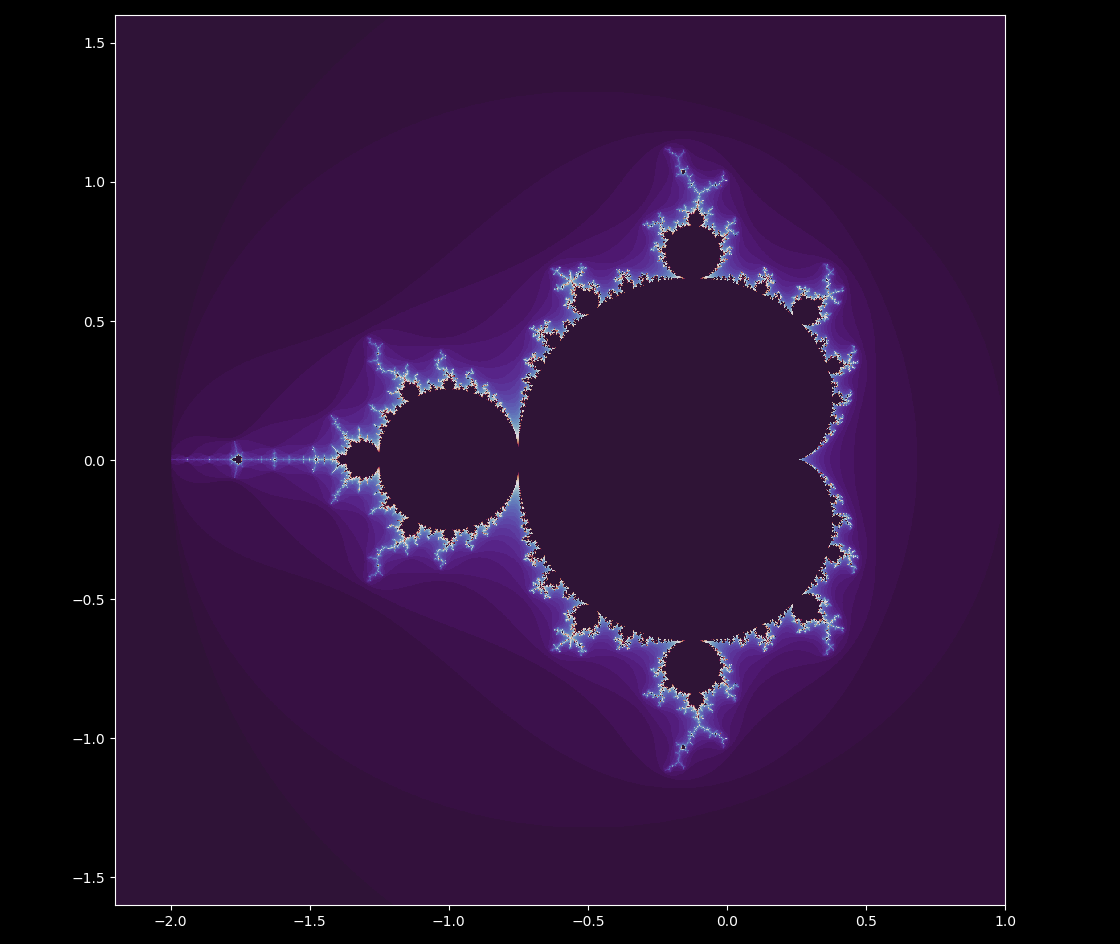
The colors are accurate now! The above code (except with slightly larger x and y ranges used to initialize the ogrid) may be called with the kwarg extent in order to provide accurate axes makers as follows:
plt.imshow(mandelbrot_set(2000, 2000, 70), cmap='twilight_shifted', extent=[-2.2, 1, -1.6, 1.6])
plt.axis('on')
plt.show()
which yields

To reorient ourselves, the dark area in the center is composed of all the points that do not diverge (head towards positive or negative infinity) after the specified maximum number of iterations. The light areas bordering this are the points that diverge but not immediately, and the purple region that surrounds the shape is the region that quickly heads towards infinity.
The Mandelbrot set is a very rich fractal. Here is a zoom on the point - 0.74797 - 0.072500001i (see here for a description of how to make the video)

And here is the same point, increasing scale to a factor of $2^{42}$ (over four trillion)
What happens if we change the exponent of (2) such that $z^1 \to z^4$ ? At $z^1$, the equation is linear and a circular region about the origin remains bounded. But as the system becomes nonlinear, intricate shapes appear. Here we go from $z^1 \to z^4 \to z^1$, and note that the positive real axis is pointed up instead of to the right.

Translations and rotations
What happens if there is a small amount $b$ added upon each iteration? Then we have $z_{n+1} = z_n^2 + a + b$, which is equivalent to changing $a$ by a constant factor for all values in the complex plane. This results in the map being translated in the complex plane, but not otherwise changed.
The effect is quite different if the starting value $z_0 \neq 0 + 0i$. We are now departing from a true Mandelbrot set, which requires the initial value to be $0$, but a small change like setting $z_0 = a$ will result in a set that mostly resembles the Mandelbrot set $\mathscr M$. But if some value $b$ is added upon each iteration, the set of non-diverging points changes unpredictably, reflecting the irregularity of $\mathscr M$ itself.
To summarize, the following equation shall be investigated:
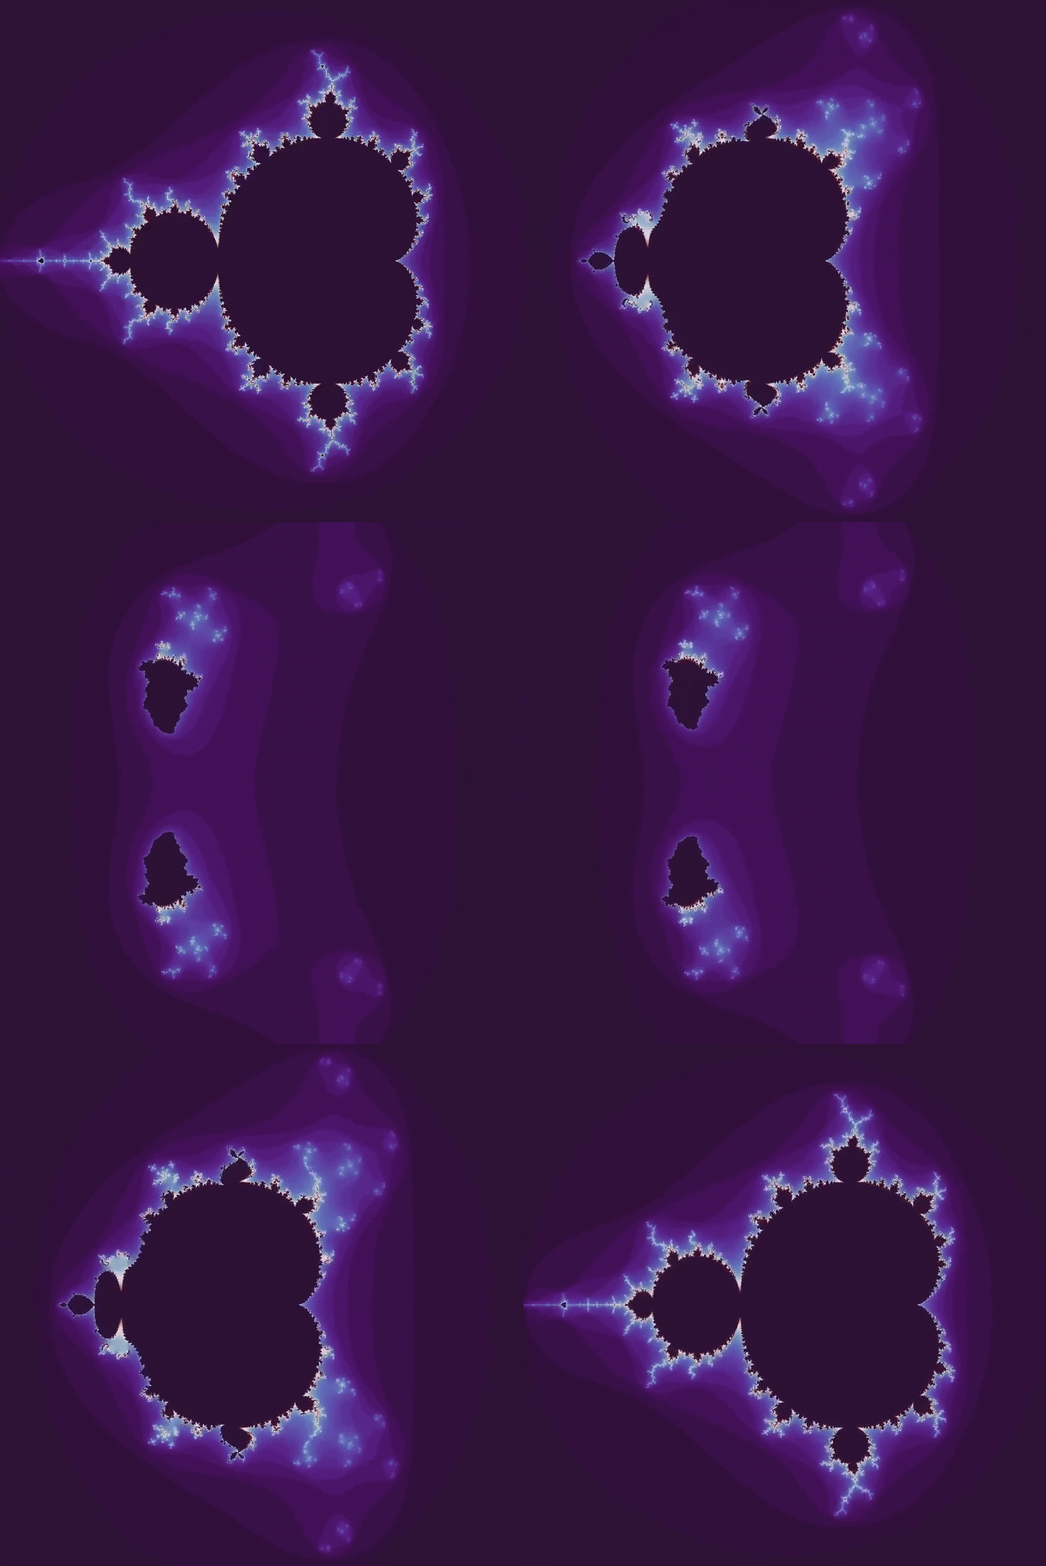
\[z_{n+1} = z_n^2 + a + b \\ z_0 = a \\ \tag{2}\]Let’s look at the bounded iterations of (2) with many real values of $b$, going from $b=0 \to b=1.3 \to b=0$ as follows:
def mandelbrot_set(h_range, w_range, max_iterations, t):
	...
	# make an array with all elements set to 'True'
	not_already_diverged = a_array < 1000
	z_array = a_array # set initial z_array values to a_array points

	for i in range(max_iterations):
		# mandelbrot equation
		z_array = z_array**2 + a_array + (1.3/300)*t
		...

In the other direction, $b=0 \to b = -2.5$ yields

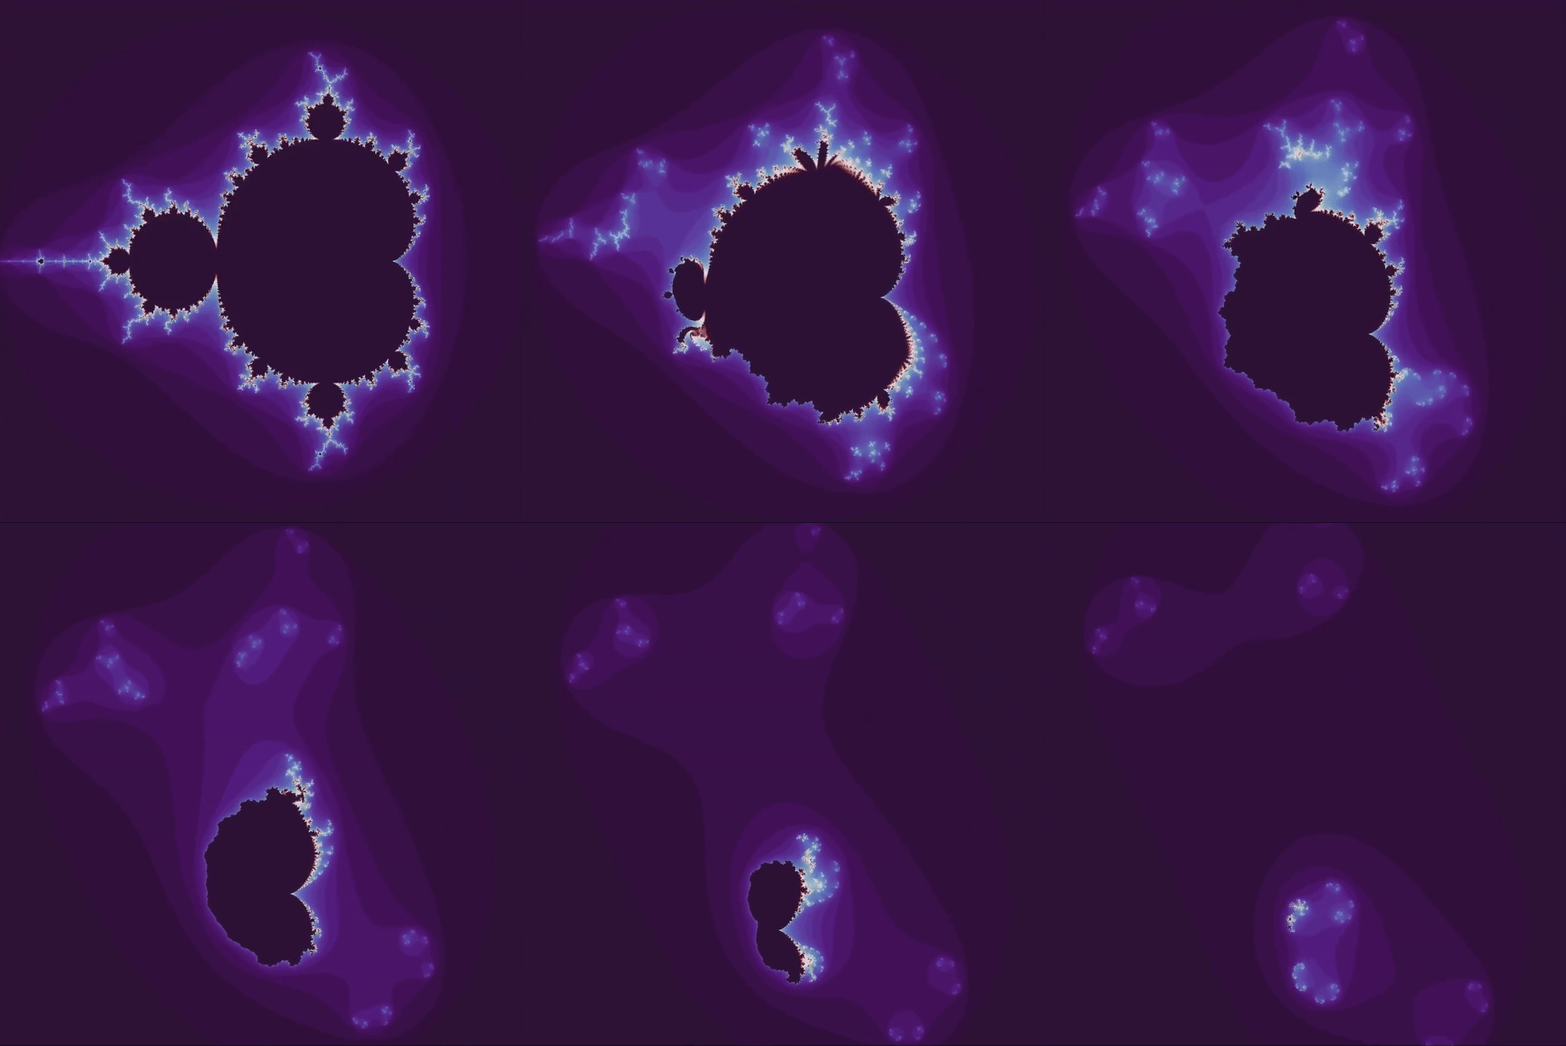
How about if we move to a complex number? The set from $b = 0 \to b = 1 + i$ looks like

Instead of moving from the origin to a given point $b$, let’s try rotating about the origin at a radius $r$. Luckily we are already working with complex numbers so this can be done using Euler’s formula
\[e^{i y} = \cos(y) + i \sin(y)\]so if we want one complete rotation ($2\pi$ radians) after 300 images (the usual length of the videos on this page) of a point centered at a radius of $1/3$,
	...

	for i in range(max_iterations):
		# mandelbrot equation
		z_array = z_array**2 + a_array + np.exp(3.1415j * (t/150))/3
which yields

Euler’s formula can be found using infinite series, which are sums of infinitely long sequences. Power series centered at $0$ (also called Maclaurin series) can be expressed as
\[f(x) = c_0 + c_1(x) + c_2(x)^2 + c_3(x)^3 + \cdots\]and have coefficients equal to
\[c_n = \frac{f^{(n)}(0)}{n!}\]where $f^{(n)}$ corresponds to the nth derivative of $f$, which can be found by noting that $f’(0) = 1c_1$ and $f’’ (0) = 2 \cdot 1c_2$ and $f’’’ (0) = 3 \cdot 2 \cdot 1c_3$ etc.
Therefore if a power series exists for any function $f(x)$, it has the form
\[f(x) = \sum_{n = 0}^\infty \frac{f^{(n)}(x)}{n!} x^n\]Checking Taylor’s inequality, it can be verified that $e^x$ can be represented by a power series, which is
\[e^x = \sum_{n=0}^\infty \frac{z^n}{n!} = 1 + z + \frac{z^2}{2!} + \frac{z^3}{3!} + \cdots\]and the same is true for sine and cosine, which are
\[\sin(x) = \sum_{n=0}^\infty (-1)^n\frac{z^{2n+1}}{(2n+1)!} = z - \frac{z^3}{3!} + \frac{z^5}{5!} - \cdots \\ \cos(x) = \sum_{n=0}^\infty (-1)^{n}\frac{z^{2n}}{(2n)!} = 1 - \frac{z^2}{2!} + \frac{z^4}{4!} - \cdots\]Expressing $e^{iz}$ as an infinite sum proceeds by substituting $x = iz$ and remembering that successive powers of $i$ yield the 4-cycle $(i, \; -1, \; -i,\; 1, \dots)$ which altogether is
\[e^{iz} = 1 + iz + i^2\frac{z^2}{2!} + i^3\frac{z^3}{3!} + i^4\frac{z^4}{4!} + \cdots \\ e^{iz} = 1 + iz - \frac{z^2}{2!} - i\frac{z^3}{3!} + \frac{z^4}{4!} + \cdots \\\]and now splitting the series by taking every other term,
\[e^{iz} = \left( 1 - \frac{z^2}{2!} + \frac{z^4}{4!} - \cdots \right) + \\ i \left( z - \frac{z^3}{3!} + \frac{z^5}{5!} - \cdots \right) \\ e^{iz} = \cos(z) + i \sin(z)\]Evaluating Euler’s formula with $x= i\pi$ gives the beautiful identity
\[e^{i\pi} + 1 = 0\]which relates two of the best known transcendental numbers with the two arithmetic identities.